Frame definitions & rotations tests
11/12/19
Demo ePSproc functions: - setPolGeoms() - setADMs() - TKQarrayRotX()
Functions under development Dec. 2019.
Load functions
[1]:
import sys
# import os
# import time
import numpy as np

# For module testing, include path to module here
# modPath = r'D:\code\github\ePSproc'
modPath = r'/home/femtolab/github/ePSproc/'
sys.path.append(modPath)
import epsproc as ep
* pyevtk not found, VTK export not available.
* plotly not found, plotly plots not available.
Polarization geometries
[2]:
# Set default frame defns
RXdefault = ep.setPolGeoms()
print(RXdefault)
<xarray.DataArray (Euler: 3)>
array([quaternion(1, -0, 0, 0),
       quaternion(0.707106781186548, -0, 0.707106781186547, 0),
       quaternion(0.5, -0.5, 0.5, 0.5)], dtype=quaternion)
Coordinates:
  * Euler    (Euler) MultiIndex
  - P        (Euler) float64 0.0 0.0 1.571
  - T        (Euler) float64 0.0 1.571 1.571
  - C        (Euler) float64 0.0 0.0 0.0
    Labels   (Euler) <U18 'z' 'x' 'y'
Attributes:
    dataType:  Euler
[3]:
# Set some additional test geometries
pRot = [0, 0, np.pi/2, np.pi/2]
tRot = [np.pi/4, -np.pi/4, np.pi/4, 3*np.pi/4]
cRot = [0, 0, 0, 0]
labels = ['+45x', '-45x', '+45y', '+135y']

eulerAngs = np.array([pRot, tRot, cRot]).T

RX = ep.setPolGeoms(eulerAngs = eulerAngs, labels = labels)
RX
[3]:
<xarray.DataArray (Euler: 4)>
array([quaternion(0.923879532511287, -0, 0.38268343236509, 0),
       quaternion(0.923879532511287, 0, -0.38268343236509, 0),
       quaternion(0.653281482438188, -0.270598050073098, 0.270598050073099, 0.653281482438188),
       quaternion(0.270598050073099, -0.653281482438188, 0.653281482438188, 0.270598050073099)],
      dtype=quaternion)
Coordinates:
  * Euler    (Euler) MultiIndex
  - P        (Euler) float64 0.0 0.0 1.571 1.571
  - T        (Euler) float64 0.7854 -0.7854 0.7854 2.356
  - C        (Euler) float64 0.0 0.0 0.0 0.0
    Labels   (Euler) <U32 '+45x' '-45x' '+45y' '+135y'
Attributes:
    dataType:  Euler
Test frame defns + rotations
Test with ADM distribution
Set a \(Y_{0,0} + Y_{1,0}\) function and rotate.
[4]:
# Set using setADMs()
# Y10 = ep.setADMs(np.array([1,0,1], ndmin=2), addS = True)
Y10 = ep.setADMs(np.array([[0,0,1],[1,0,1.3]]), addS = True)
Y10
[4]:
<xarray.DataArray (ADM: 2, t: 1)>
array([[1. ],
       [1.3]])
Coordinates:
  * ADM      (ADM) MultiIndex
  - K        (ADM) int64 0 1
  - Q        (ADM) int64 0 0
  - S        (ADM) int64 0 0
  * t        (t) int64 0
Attributes:
    dataType:  ADM
[5]:
# Y10.copy().unstack('ADM').rename({'K':'l', 'Q':'m'}).drop('S').stack({'BLM':('l','m')})
[6]:
# ep.sphFromBLMPlot(Y10, facetDim = 'Eke', pType='a', plotFlag = True);
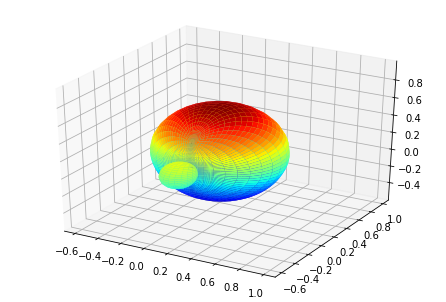
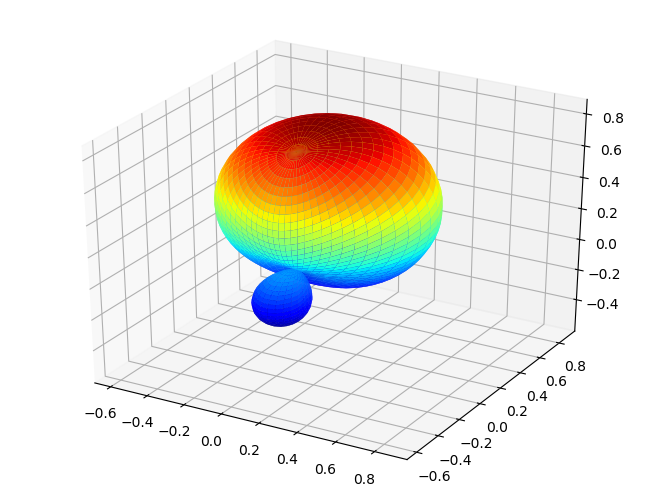
ep.sphFromBLMPlot(Y10, pType='a', plotFlag = True);
Plotting with mpl

[7]:
# Rotations (z,x,y) case
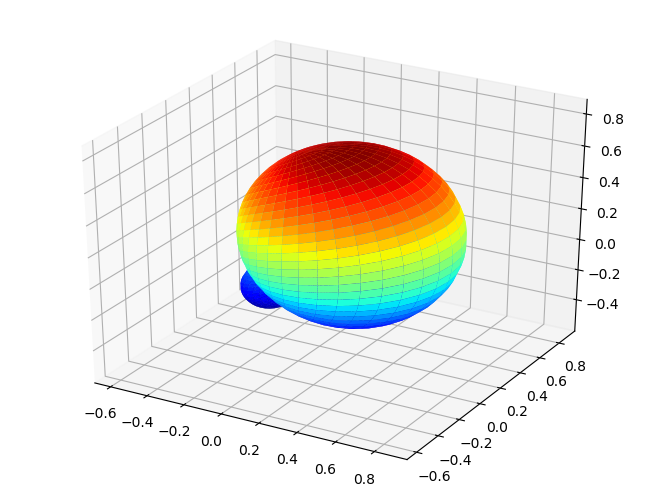
Y10rot, _, _ = ep.TKQarrayRotX(Y10, RXdefault)
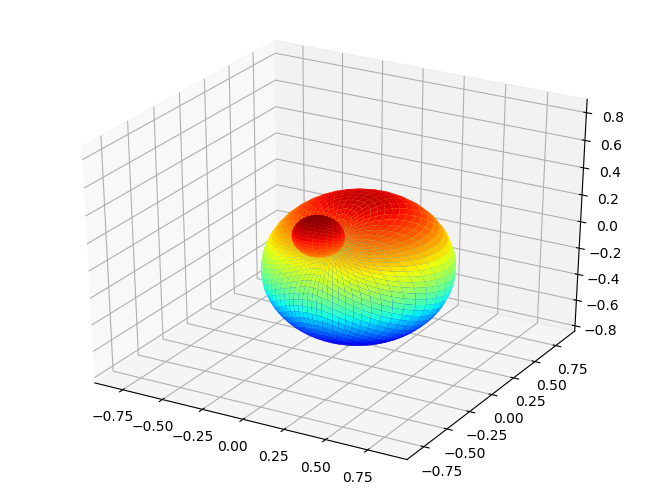
ep.sphFromBLMPlot(Y10rot, facetDim = 'Euler', pType='a', plotFlag = True);
Plotting with mpl
Data dims: ('Euler', 'Theta', 'Phi'), subplots on Euler
[8]:
# Use lmPlot() with Euler groups
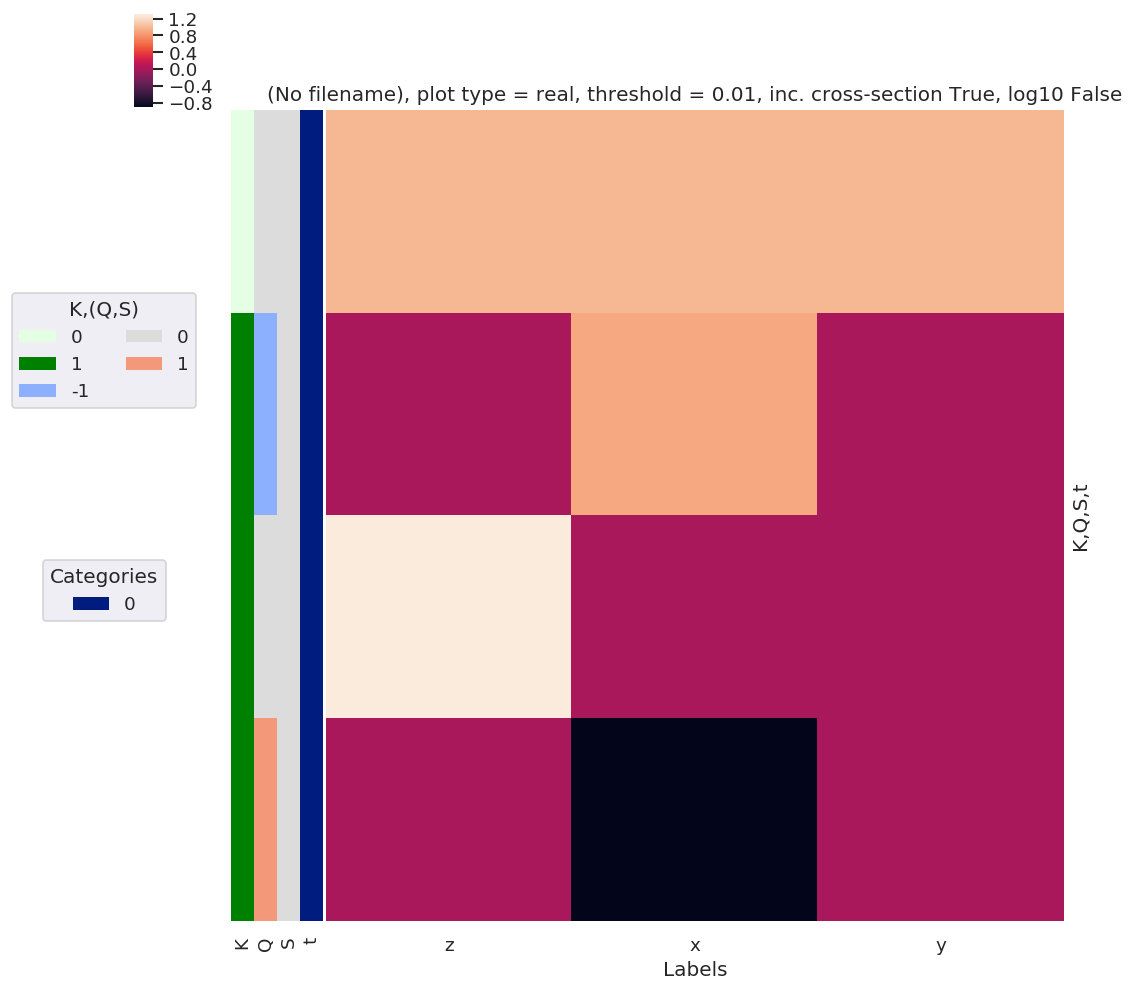
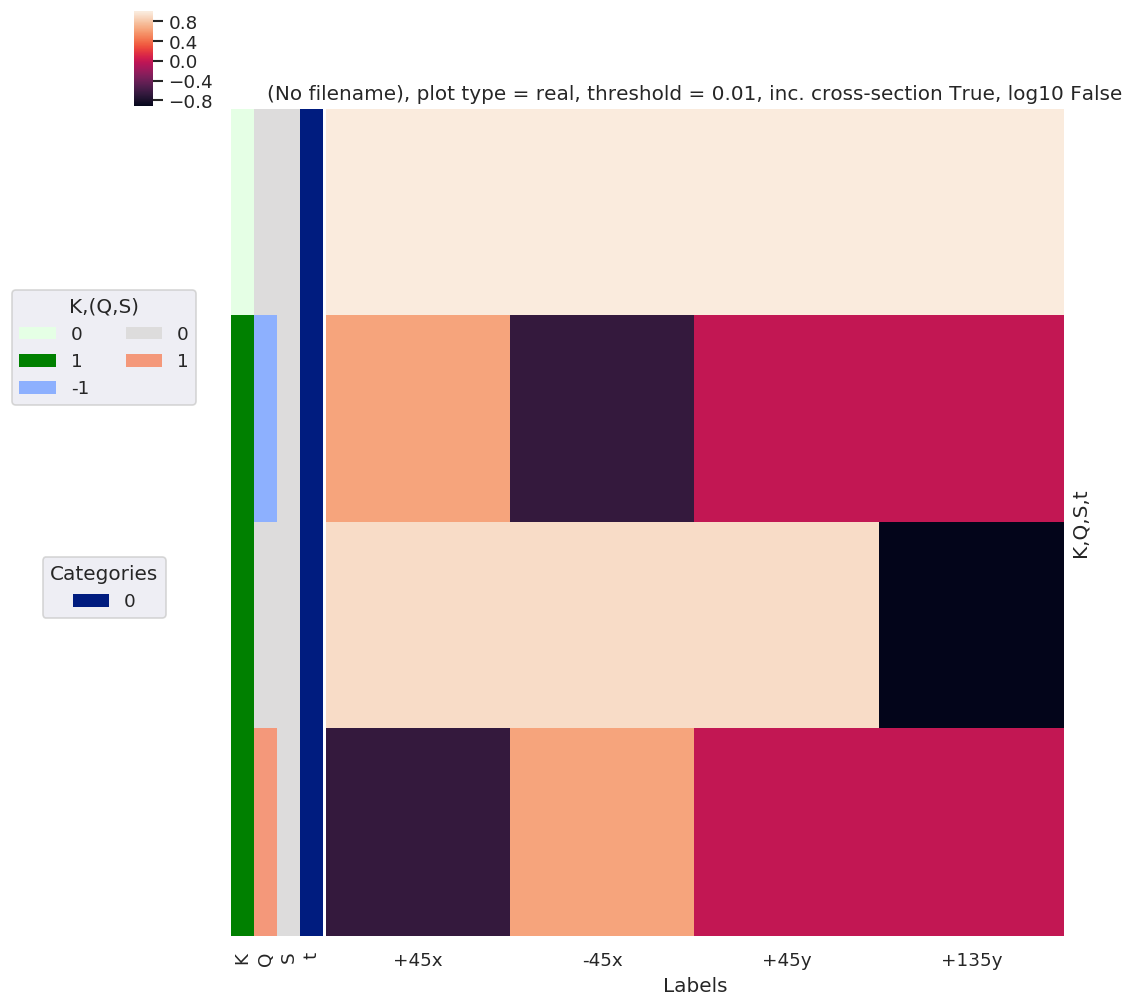
ep.lmPlot(Y10rot, plotDims = ('K','Q','S','t'), xDim = 'Labels', pType = 'r');
Plotting data (No filename), pType=r, thres=0.01, with Seaborn
[9]:
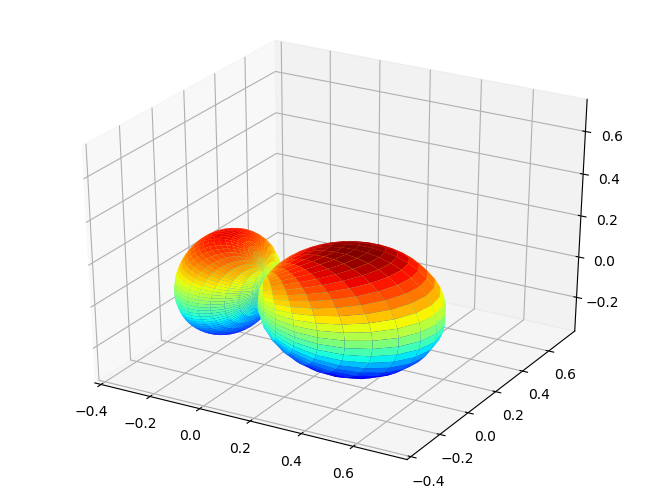
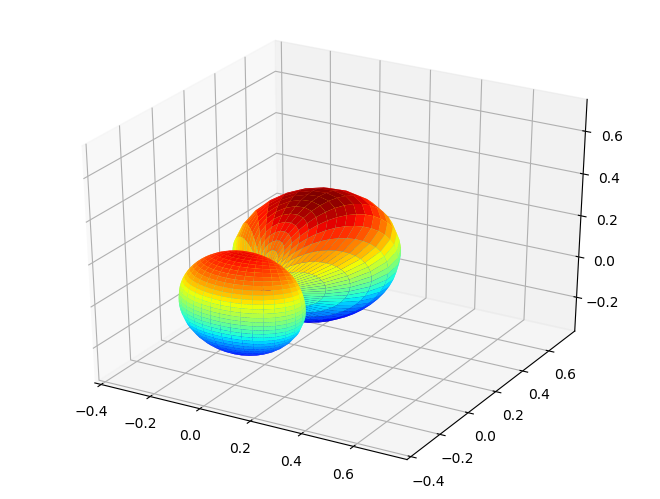
# Rotations +/-45 deg cases
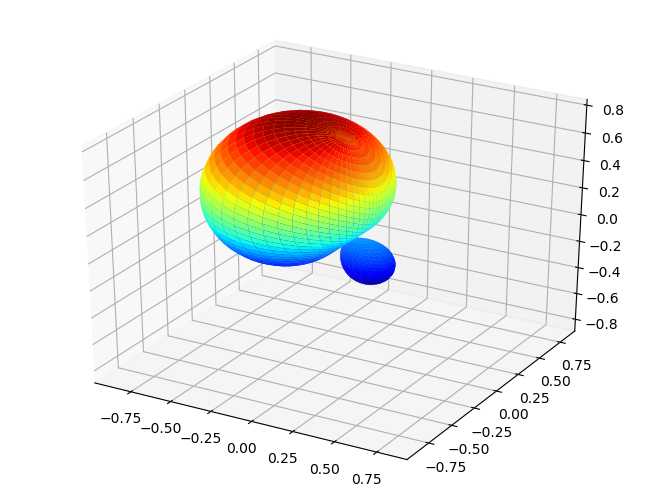
Y10rot, _, _ = ep.TKQarrayRotX(Y10, RX)
ep.sphFromBLMPlot(Y10rot, facetDim = 'Euler', pType='a', plotFlag = True);
Plotting with mpl
Data dims: ('Euler', 'Theta', 'Phi'), subplots on Euler
[10]:
# Tabulate with Pandas, by label

# Replace null terms with Nans and remove
# Y10rotpd = Y10rot.drop('Euler').swap_dims({'Euler':'Labels'}).unstack().stack(plotDim = ('Labels','K','Q','S')).to_pandas().replace(0,np.nan).dropna(axis = 1).T

# Alternatively, drop by gt comparison & indexing
Y10rotpd = Y10rot.drop('Euler').swap_dims({'Euler':'Labels'}).unstack().stack(plotDim = ('Labels','K','Q','S')).to_pandas().T
Y10rotpd = Y10rotpd[Y10rotpd.abs().gt(1e-2)].dropna()

Y10rotpd
[10]:
| t | 0 | |||
|---|---|---|---|---|
| Labels | K | Q | S | |
| +45x | 0 | 0 | 0 | 1.000000+0.000000j |
| 1 | -1 | 0 | 0.650000+0.000000j | |
| 0 | 0 | 0.919239+0.000000j | ||
| 1 | 0 | -0.650000+0.000000j | ||
| -45x | 0 | 0 | 0 | 1.000000+0.000000j |
| 1 | -1 | 0 | -0.650000-0.000000j | |
| 0 | 0 | 0.919239+0.000000j | ||
| 1 | 0 | 0.650000-0.000000j | ||
| +45y | 0 | 0 | 0 | 1.000000+0.000000j |
| 1 | -1 | 0 | 0.000000+0.650000j | |
| 0 | 0 | 0.919239+0.000000j | ||
| 1 | 0 | -0.000000+0.650000j | ||
| +135y | 0 | 0 | 0 | 1.000000+0.000000j |
| 1 | -1 | 0 | 0.000000+0.650000j | |
| 0 | 0 | -0.919239+0.000000j | ||
| 1 | 0 | -0.000000+0.650000j |
[11]:
# Use lmPlot() with Euler groups
ep.lmPlot(Y10rot, plotDims = ('K','Q','S','t'), xDim = 'Labels', pType = 'r');
Plotting data (No filename), pType=r, thres=0.01, with Seaborn
Test with \(\beta_{LM}\)
[12]:
Ysum = ep.blmXarray(np.array([[1,0,1],[2,0,0.3]]), 1)
Ysum
[12]:
<xarray.DataArray (Eke: 1, BLM: 2)>
array([[1. , 0.3]])
Coordinates:
  * Eke      (Eke) int64 1
  * BLM      (BLM) MultiIndex
  - l        (BLM) int64 1 2
  - m        (BLM) int64 0 0
Attributes:
    dataType:  BLM
[13]:
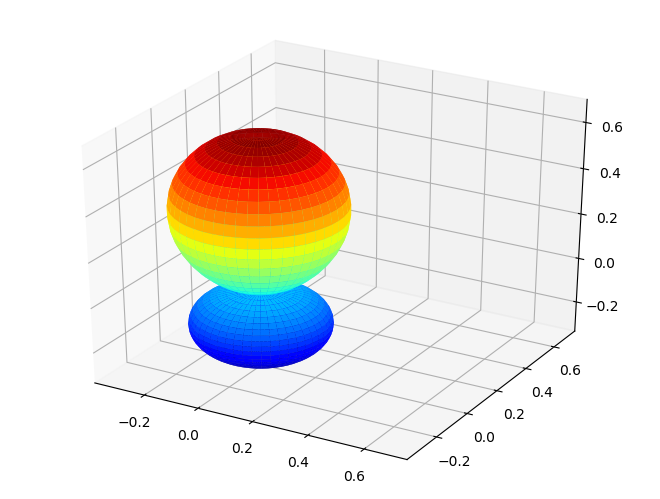
ep.sphFromBLMPlot(Ysum, facetDim = 'Eke', pType='a', plotFlag = True);
Plotting with mpl
Data dims: ('Eke', 'Theta', 'Phi'), subplots on Eke
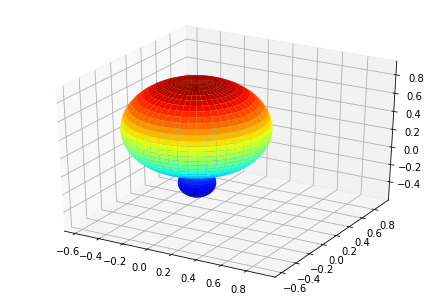
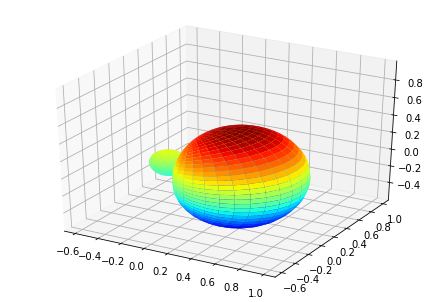
[14]:
# Rotations (z,x,y) case
Ysumrot, _, _ = ep.TKQarrayRotX(Ysum, RXdefault)
ep.sphFromBLMPlot(Ysumrot, facetDim = 'Euler', pType='a', plotFlag = True);
Plotting with mpl
Data dims: ('Eke', 'S', 'Euler', 'Theta', 'Phi'), subplots on Euler